5.
Published onThe responses to the following information requests were taken into account in determining the assigned category and developing the assessment:
Ministry of Energy
https://drive.google.com/file/d/1R2DVDIEcqLcYp8z66G7UsopAj8QERrDO/view?usp=drive_link
Further information:
- https://www.indec.gob.ar/indec/web/Nivel4-Tema-3-36-145
- https://www.indec.gob.ar/indec/web/Nivel3-Tema-3-9
-
https://adefa.org.ar/es/estadisticas-anuarios
The table below presents the reconstruction of the 2016–2030 trend (business-as-usual) scenario prepared by the National Secretariat of Energy.
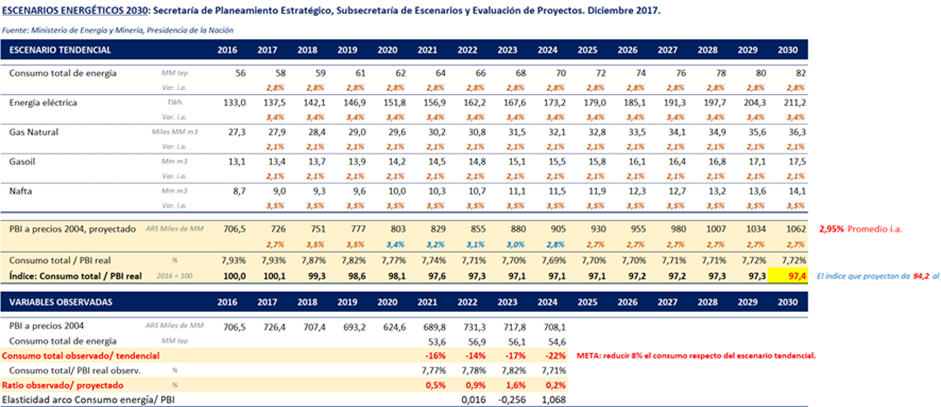
In addition, the OBSERVED VARIABLES are shown using total energy consumption [see 1] (as a proxy for energy demand), based on the National Energy Balance for 2024, 2023, 2022 and 2021; Excel tables available at https://www.argentina.gob.ar/econom%C3%ADa/energ%C3%ADa/planeamiento-energetico/balances-energeticos
Actual total energy consumption is compared with the consumption projected under the trend scenario. It can be seen that for 2024 (and prior years), energy demand (total energy consumption) is 22% lower than the trend scenario projected in 2016.
This lower energy demand is partly explained by the gap between actual GDP and the GDP projected from 2019 onward, which dampened energy demand. In this regard, the ratio of total consumption to actual GDP observed is 0.2% higher than projected for 2024, and it shows a clear reduction compared with the larger divergence recorded in previous years (2021–2023) when comparing observed vs. projected ratios.
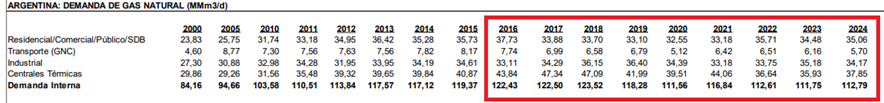
The table below, taken from the Energy Report of the Institute of Energy at Universidad Austral (Vol. 52, July 2025), shows the decline in total natural gas demand between 2016 and 2024.
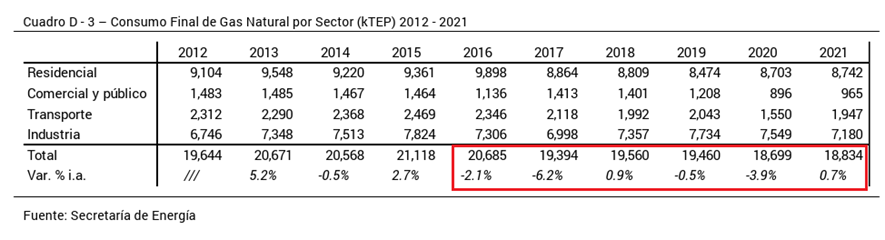
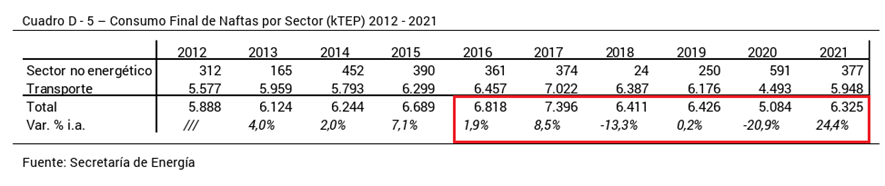
Below are tables from the National Energy Balance; Historical Series – Indicators. Updated to 2021. (National Secretariat of Energy). Available at: https://www.argentina.gob.ar/econom%C3%ADa/energ%C3%ADa/planeamiento-energetico/balances-energeticos
At the link: National Energy Balance – Historical Summary 1960–2021.
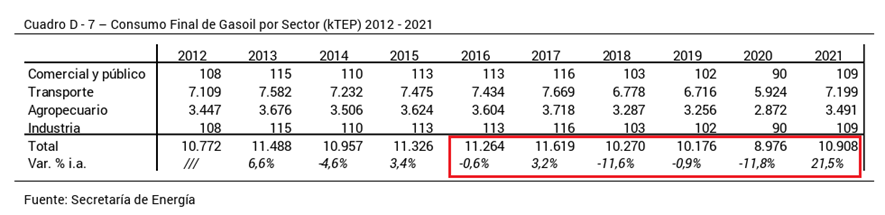
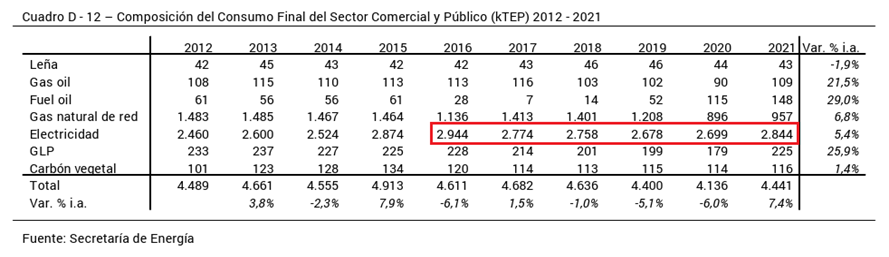
These tables show the evolution of final consumption from 2016 to 2021 by energy segment, highlighting the reduction in consumption levels:
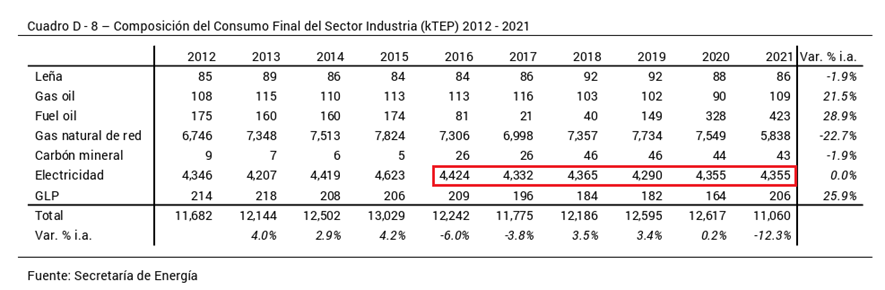
It is worth noting the stable electricity consumption of the industrial sector between 2016 and 2021:
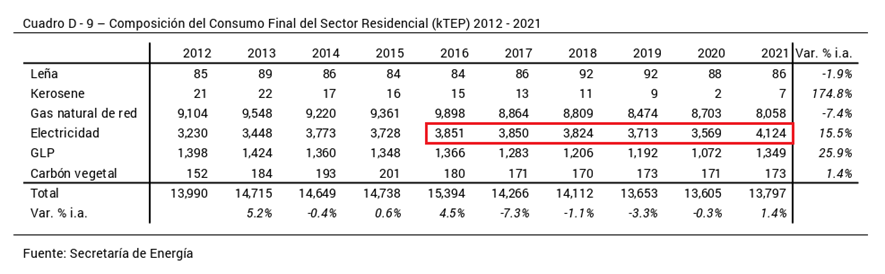
A similar pattern can be observed for the residential sector up to 2020:
There is also a reduction in the amount of energy consumed relative to GDP and per capita between 2016 and 2021:
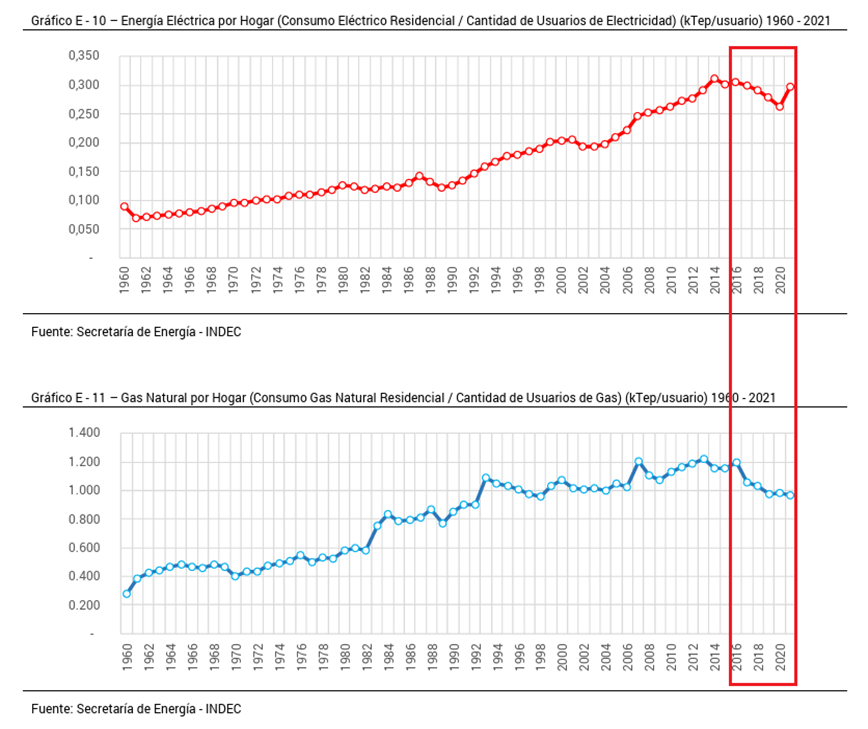
It is worth highlighting the decline in energy-use intensity in the residential sector, the target of several policies promoting the replacement of household appliances with higher energy efficiency through awareness campaigns and other measures:
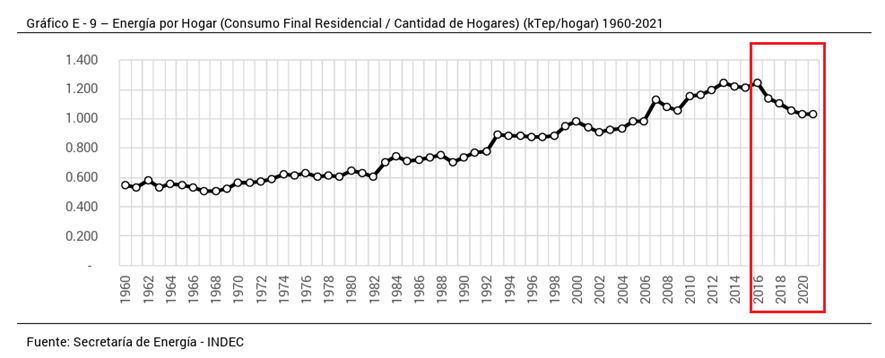
With the exception of a rebound in 2021, there is a reduction in the intensity of electricity use (policies encouraging replacement of appliances with better efficiency, as evidenced by labeling) and of gas use (policies related to heating and others) per household:
[1] Based on data from the National Energy Balance 2024, 2023, 2022 and 2021; Excel tables available at https://www.argentina.gob.ar/econom%C3%ADa/energ%C3%ADa/planeamiento-energetico/balances-energeticos
FIRST ASSESSMENT OF THIS OBJECTIVE CONDUCTED IN AUGUST 2025
Category
Moderate progress
Detail
Energy demand in 2024 was 22% below the business-as-usual scenario projected in 2016. This reduction was partly attributable to energy efficiency policies, but primarily to lower economic growth than anticipated. Energy intensity—consumption relative to GDP—has shown a downward trend since 2016, with improvements in the residential, industrial and commercial sectors, supported by technology replacement and awareness-raising programmes. Overall, the objective falls within the “Moderate progress” category.